Birger Larsen – Dynamics 365 for operations blog on WMS

WMS, Distribution, Logistics, Birger, Larsen, AX, 2012, WAX, TRAX, Dynamics 365

Warehouse workspaces – a no-code approach to increase warehouse efficiency — February 22, 2023

Warehouse workspaces – a no-code approach to increase warehouse efficiency

A warehouse workspace in Dynamics 365 for operations (D365FO) is a cost-effective tool, that can increase efficiency and productivity in the warehouse. Warehouse workspaces can provide excellent overview on daily operations in the warehouse and alert supervisors when intervention is required.

This is the second of two post on warehouse workspaces. In the first post I discussed how to create open work tiles, planned work /date filtered tiles, work exception tiles and more.

In this second post I will discuss how you can make your warehouse workspace truly warehouse/user context sensitive. I will also go through some more advanced tiles that you can apply in your warehouse workspace, including

  • Pick work blocked by pending replenishment work
  • Preventive tiles revealing incorrect warehouse master data
  • SQL based tiles with logical / numerical expressions revealing e.g. work sequence anomalies
Example workspace from pallet distribution warehouse

Pick work blocked by replenishment

Wave replenishment work is created when there’s not enough inventory in the pick zone for sales pick work. Wave replenishment work will transfer items from the bulk zone to the pick zone. Wave replenishment work is linked to picking work and must be completed before the related pick work can be executed.

If you have setup wave replenishment in the warehouse – you will want an overview of sales pick work being blocked by outstanding wave replenishment work – so you can prioritize the replenishment accordingly.

To construct a tile displaying sales work blocked by replenishment, is a little more complicated than a simple open work tile – because it requires you to add a number of joins in the query behind the tile.

Start by opening the All work form (Warehouse management > Work > All work) and click Advanced filter or sort.

Now follow these steps

Now pick lines blocked by replenishment work are displayed. Save the view and add it to your workspace.

Preventive tiles – incorrect master data

Incorrect or missing master data can seriously impact warehouse operations. This problem is extra relevant in a go-live situation. In the first months projects often struggle with incorrect master data. Just one missing information on master data – can block a process and tie up many people trying to find root cause of the blocked process. It’s therefore critical to be proactive in identifying missing master data setup.

Some examples are:

  • Missing filter codes on items (e.g. used to control putaway strategy, pick process, cycle count frequency)
  • Missing fixed location (e.g. used to control putaway, replenishment or pick processes)
  • Missing Unit sequence group id (will block for all warehouse processes)
  • Lack of unit conversions (Can mess up your pick process)
  • Quality associations (can bypass mandatory quality control)

The warehouse workspace can help you to mitigate these issues using preventive tiles revealing incorrect master data setup. In the example below I create a tile displaying all items without a fixed location.

Open the Released products form (Product information management > Products > Released products ) and click on Advanced filter or sort. Join the released products against the fixed locations. But make sure you select the Notexist join – as that will ensure that only products with no fixed locations will be displayed in your tile.

Also add a join to Warehouse item number – so the joins sections looks like this:

Now filter the range section e.g. like I did below. Typically not all your items are required to have a fixed location. So your filter should ensure that only relevant items are checked for fixed locations. In my example I filtered on a particular item group, but it could also be a filtercode or some other field on the item indicating if fixed location is required or not.

Save the view and add the tile to the workspace.

A variation on the above is to design a tile showing items on open sales orders without fixed locations. This tile will require immediate intervention as the picking process may fail due to lack of fixed location setup (depending on your processes and location directive setup of course).

One workspace – many warehouses issue

On one of my recent projects – the customer had hundreds of warehouses in same legal entity. If you have that many (similar) warehouses in your company – then you typically want to design a workspace that can be used by all the warehouses. But how do you achieve that warehouse employees only sees data related to the warehouse they work in and not data from other warehouses?

If you only have two warehouse – then you can solve this by creating two similar workspaces – where you filter tiles/datalists/links on the two warehouses respectively. But if you have 10 or perhaps 100+ warehouses, then the setup and maintenance task of setting up 10 or 100+ workspaces becomes impossible to manage. Fortunately there is a solution to this.

The solution is that you can define tiles, datalists and links to filter data on the warehouse that the logged-in user is related to. To create the relation between the user and the warehouse – you can create the user as a warehouse worker. Typically you would only create users that use mobile devices here – but you can also create users as WMS workers with the sole purpose of creating a relationship between the user and a warehouse. Yes it’s a workaround – but it’s for free 🙂

Open the worker form (Warehouse management > Setup > Worker) to create the workspace user as a worker. Note that it’s important to create the worker with same user id as the D365FO userid.

With the setup above you can now define your tiles to only display data from the logged-in users warehouse. In the example below I use this to create a tile that displays planned – but not yet released loads – from the logged-in users warehouse.

Open the All loads form (Transportation management > Planning Loads > All loads) and click advanced filter or sort.

Setup the join section as displayed below

Setup the range section to filter on the logged-in user by applying the (CurrentUserId()) function as displayed below

Save the view and add to your workspace.

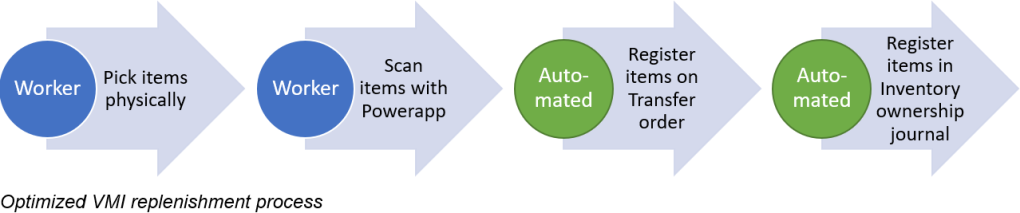
You can use this method on all warehouse workspace tiles so the entire workspace will always display data from the logged-in users warehouse. All the tiles in the the example warehouse workspace in the start of the post are made like this.

Finding ghost pallets using SQL and creative joining

An example of a tile that can not be solved using normal queries – was a request for a tile that would display “ghost” pallets in the production output locations. By ghost pallets I mean pallets that the operator physically putaway, but forgot to scan away from the production out location.

For this particular customer the pallets come out of the production on a conveyor belt. The pallets are putaway in the same sequence they are reported as finished from production. It’s therefore possible to construct a tile that for each pallet on the production out location checks if other pallets (that was created after this pallet) has been putaway. If that is the case – then the pallet most likely is a ghost pallet that is physically putaway – but system wise still appears to be on-hand on the production out location.

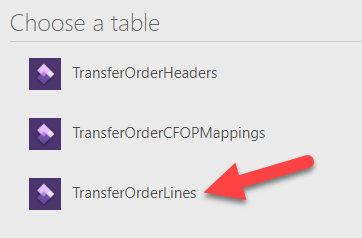
Create the tile by opening the All work form (Warehouse management > Work > All work) and click Advanced filter or sort.

The reason for joining the first work lines to the work is that want to be able to filter work on the PRODRECV location, which can be found on the worklines related to the work. The reason for joining work lines to locations and then back to work lines is that we want to check if other work lines exists against the prodrecv location that has been created after the first work and has been closed. We can do that with this join sequence.

Now setup the range section as displayed below. The main trick here is the SQL statement comparing the creation date of the open putaway work with the creation date/time of other closed putaway work on the same location. Note that the second set of worklines are referenced as WHSworkline_1. Not especially intuitive – and not really documented anywhere to my knowledge. I just experimented until it worked…

Now save the view and add to the workspace.

In my demo data I find exactly 1 ghost pallet. When looking at the putaway work you can see that is correct because pallet 203 is still not putaway while successors 204 and 205 have been putaway.

Links in the workspace

Besides tiles and data lists you can also add links to the warehouse workspace. I typically add links to sales/purchase/transfer orders, locations, fixed locations, on-hand, journals and other forms that the warehouse staff need to access in their daily work. The mindset here is that warehouse staff should be able to perform all tasks starting from the warehouse workspace.

Note that the links can contain filters. So you can e.g. create a link that will open the all sales order forms, but filtered on the warehouse that the user is related to. You can achieve this by applying the warehouse/user workaround discussed in previous section.

Limitations / wishlist

It’s useful to add journal related tiles/data lists that display e.g. movement journals not approved or not posted. The journal forms are however constructed with hardcoded filter on the logged-in user. There’s some annoying side effects of this:

  • When another user clicks on a journal tile – then records displayed will not be filtered correctly. You can create it as a datalist instead as a workaround to this.
  • Warehouse workspaces containing journal tiles/data lists can only be exported/imported to other environments by the user that created the journal tile/data list

You can not link to jobs/ reports – like the release to warehouse batch job.

Group by function on data list fields is not saved when exiting the workspace.

Some forms do still not support workspaces properly – e.g. work details.

It would be great if MS could fix the above limitations…

Besides fixing the above limitations I have this nice-to-have wishlist:

  • Ability to link to external URL’s
  • Ability to control colors of the tiles
  • Ability to control tile position more precisely – e.g. which tiles that are displayed on row 1, 2 etc.
  • It would be great to be able to display 2 numbers on a tile – something like 2 open works of 13 total (would require 2 queries related to a tile).
  • For a particular tile to be able to specify update frequency (e.g. every minute) instead of the default (typically every 10 mins).

To sum up – D365FO warehouse workspaces offer a powerful, no-code cost-effective solution for optimizing and streamlining warehouse operations. With tailored tiles, data lists and links, these workspaces can help you increase efficiency, productivity, and customer satisfaction.

Warehouse workspaces – the lowest hanging fruits on the D365FO tree? — February 4, 2023

Warehouse workspaces – the lowest hanging fruits on the D365FO tree?

Are you looking for a cost-effective way to increase efficiency and productivity in your warehouse operations? Warehouse workspaces in Dynamics 365 for operations (D365FO) can provide excellent overview on daily operations in the warehouse and alert supervisors when intervention is required.

This is the first of two posts on warehouse workspaces. In these two posts I will discuss how to create tiles and data lists that will provide warehouse staff with a complete overview on daily tasks and exceptions that require their attention. You can find the second post here.

I will also provide detailed recipes on how to create date/user filtered work tiles and more advanced Jedi Master tiles, like

  • Preventive tiles revealing incorrect warehouse master data
  • Work exceptions requiring supervisor interaction
  • Warehouse work blocked/delayed by other processes
  • SQL based tiles with logical / numerical expressions revealing e.g. “ghost” pallets / work sequence anomalies
Example workspace with priority / cut-off driven processes

While my focus in this post is warehouse workspaces – the types of tiles demonstrated in this post can be applied in other SCM workspaces as well – like order management, procurement, planning, manufacturing etc.

Supporting the resilient supply chain

What’s really great about warehouse workspaces is that they can be tailored to the specific processes and layout of your warehouse without requiring expensive customizations. You can therefore design a warehouse workspace that can provide your warehouse staff with all the necessary tools and information they need in one place.

The actual configuration of the workspace can be done by superusers or consultants and do not require assistance from a developer. Furthermore the workspace can easily be shared to other users.

Example workspace from warehouse using pack stations

A basic workspace can be setup in a day – and more advanced perhaps within a week. This allows for fast adaptation to changes in the supply chain. In an increasingly uncertain world, supply chain resiliency is becoming a top priority for many companies. The warehouse workspaces supports supply chain resiliency well – because they can easily be changed or extended to accommodate new process variations in the warehouse.

If you suddenly need to source an item from several vendors and the sourcing from the new vendor requires a new quality inspection step or perhaps a value adding service – then a new tile can quickly be setup in the workspace to monitor this new process variation and create transparency around the changed process.

Overlooked opportunity

Surprisingly enough workspaces seems to be somewhat overlooked by D365FO implementation partners. My impression is that workspaces are considered mainly as a superuser tool. Workspaces are therefore often not considered in the project implementation model – but left as the customers responsibility.

I think that’s a pity – as customers/superusers are typically not aware of the efficiency opportunities that workspaces can provide. Furthermore the best workspaces are created when consultants and superusers work together.

My hope is that this post can increase awareness of the possibilities that workspaces can provide for warehouse processes and SCM processes in general.

I have in past 3-4 years worked with workspaces – especially within the warehouse area. I remember in the start they were pretty buggy and I spent a lot of time with MS support to fix errors. My impression is that the workspace technology is now more mature and stable – especially after the introduction of saved views.

Typical warehouse workspace examples

My experience from the past warehouse projects is that warehouse workspace tiles/data lists typically fall into the following categories:

  • Open work to be completed – typically per type (putaway, raw mat pick, sales pick, transfer order pick, pack, load). Pick work is often split into several sub tiles – e.g. split by pick type, zone, priority, cut-off time etc.
  • Closed work for the day
  • Planned work/loads – e.g. scheduled loads for today, tomorrow etc.
  • Work exceptions – e.g. shortpick, location full etc.
  • Warning type situations
    • Work blocked by wave replenishment
    • Work generated on overflow locations
    • Items sitting too long on receiving location
  • Error situation
    • Work with blank location
    • Master data errors – e.g. no fixed location defined for item, putaway filtercode not specified for item on purchase order.
  • Links to master data: Locations, fixed location released products etc.
  • Links to forms used by warehouse staff: Transfer orders, journals etc.
Example workspace focused on quality processes in the warehouse

Creating a custom workspace

Creating a custom workspace with a few basic tiles, data lists and links is fairly simple and can mastered by most superusers after some hours of training. There’s already so many good blog posts and videos out there explaining how to create the workspace itself – so I will not go into details on that. If you have no experience with creating a custom workspace and basic tiles – then I recommend that you to watch this intro video by Scott Gaines before you proceed.

Open work tiles

Perhaps the most common requirement in an operational warehouse workspace is to see an overview of open work in the warehouse. Open work tiles are typically created per work type – meaning one or more tiles reflecting putaway work, one or more tiles representing sales order pick work etc.

Especially pick work is often split into several sub tiles – e.g. split by pick type (eaches/case/pallet), zone, priority, cut-off time etc. Depending on your reporting requirements you will often use either the Work pool id field or the Work template field on the work header as the basis of your pick tiles.

To illustrate this I want to create a tile that displays the number of full pallets to be picked, which in this example is all work with Work pool id = PICK-PL.

To create a tile you always start by opening the form that has the data the tile is to be based on. In this case I can use the All work form (Warehouse management > Work > All work). Now click Advanced filter or sort – to setup the query/filter for the tile.

Now setup the filter as displayed below. Note that the work status is by default excluding the closed work – so no need to adjust that.

Now only full pallet work is displayed. Save the view with a name indicating that work is filtered on full pallet work

Now add the tile to the workspace by following these steps

Open your workspace and refresh with F5. The tile is now added to the workspace. From here you would typically add more tiles to reflect all the other open work in the workspace – but I will leave that to you.

Date filtered work / load tiles

Another very common requirement is to display work or loads planned for today, tomorrow, next week etc. In the example here I will filter planned loads for the next 3 days.

Open the All loads form (Transportation management > Planning Loads > All loads) and click advanced filter or sort.

Add the Scheduled load shipping date and time field and filter using the DayRange function as displayed below. Note that you can also give negative values to the dayrange function. So if you want a tile displaying loads with “outdated” ship dates – then you could filter that with (DayRange(-999,-1). Check this link for more detailed documentation of dynamic date filters.

The loads planned for tomorrow and next 3 days are now displayed.

Again – save the view with an appropriate name and add to workspace as a Tile. In my example I selected the largest tile size 4×4. If you don’t get that option – then ensure you have enabled the “Allow users to select and change tile sizes” feature.

Work on overflow locations

If you have zones in your warehouse setup with limited capacity then you may occasionally run into overflow scenarios. One way to deal with that is to setup overflow locations. The overflow location will ensure your locations directives will not fail and block for work creation when all your normal locations are full.

Some overflow locations should never/rarely be triggered so if they suddenly do – it may indicate that something else is wrong and need supervisor attention. You will therefore want to monitor these overflow locations in your warehouse workspace.

In the example below we have a limited number of staging locations and also a rule enforcing only one load per staging location. In case more loads are released than there is available staging locations – then an overflow staging location is used.

To construct this overflow tile we will use the Work line details form (Warehouse management > Work > work line details) instead of the All works form used for open work. The Work line details form is better suited for this purpose as it will display work lines instead of work headers. The work lines will allow us to filter directly on the overflow location.

Open the work line details form and click Advanced filter or sort. Filter the Location field on the OVERFLOW location as displayed below.

Now overflow work lines are displayed.

Save the view and add it to your workspace – like described in previous section.

Work exceptions

Work exceptions in D365FO are incidents or events that interrupt the normal flow of work processes in a warehouse. These exceptions can occur during the pick or put of items and can be caused by a variety of factors such as unavailability of inventory, full locations, equipment failures, operator errors etc.

Monitoring work exceptions allows warehouse supervisors to be proactive in identifying root causes and remedy problems in the warehouse.

In the example below we want to display a list of short picks in the warehouse workspace. A shortpick work exception could indicate that system registered inventory on the location is incorrect. Seeing a shortpick in the workspace would often result in counting of the location.

To display shortpicks in the workspace follow these steps:

Open the Work exceptions log (Warehouse management > Work > Work exceptions log) and click on Advanced filter or sort. Filter the work exceptions as displayed below

Shortpick work exceptions are now displayed. Save the view and add the view to the warehouse workspace as a data list.

Short picks are now displayed directly in the warehouse workspace to alert the warehouse supervisor.

SQL tiles – numeric and logical expressions

Sometimes you get requirements from customers that can not be solved with normal queries. In a recent project the customer wanted a tile showing all transfer order loads where shipped quantity was less than ordered. I was not able to solve this using normal queries as this requires comparison of two fields (Shipped qty and ordered qty).

Fortunately you can apply “raw” SQL statements directly in your D365FO queries that will allow you more complicated logic – like logical operations on several fields and performing numerical expressions. So let me show you how I solved the customers request for transfer order loads where actual shipped qty was less than the transfer order quantity.

Open the All loads form (Transportation management > Planning Loads > All loads) and click advanced filter or sort.

Setup the joins section as below

Now filter the transfer order lines using the SQL expression below. The SQL expression deducts the shipped quantity from the ordered quantity and states that the discrepancy must be greater than zero if the record is to be included in the tile. I could also have written ((QtyShipped<QtyTransfer)) and get the same result.

Note that with SQL syntax you must use the actual table field names. You can find that by rightclicking on a field name in the form and select Form information and then Form name. The actual field name can be found in Data field.

The final result:

You can find a little more documentation on using SQL in queries in this link – but generally this area seems sparsely documented.


This is the end of the first post on warehouse workspaces. In the second post I will give some more advanced examples of the tiles and techniques, including

  • Preventive tiles identifying incorrect master data (using notexist join)
  • How to make your workspace automatically display only data from the logged-in users warehouse
  • Finding “ghost” pallets using SQL and creative joins

.

Outbound workload visualization — January 26, 2021

Outbound workload visualization

In the past few years Microsoft have invested considerably in WMS functionality in Dynamics 365 SCM. Especially the support for outbound warehouse processes like pick, pack and ship has been expanded.

But up until now, D365 SCM has lacked a good tool to provide overview on the progress of picking in the warehouse. So I was pleased to see that the just released 10.0.16 included the new Outbound workload visualization feature.

Increased awareness

The Outbound workload visualization feature provides basic visualizations of the progress of outbound warehouse processes. The visualizations are intended to be displayed on screens in the warehouse to increase worker awareness of work progress.

The Outbound workload visualization feature will allow you to select any of the fields from work and locations as the basis of a visualization. The pick work is visualized as a column bar chart (as you know it from Excel or Power BI). Some typical visualization examples could be work progress per warehouse, zone or per wave.

Furthermore the visualizations can be setup to be refreshed automatically every n’th minute -so they will always display an up-to-date work progress status.

Work pool progress visualization

I’m particularly interested in the Outbound workload visualization feature, because I’m currently involved in a warehouse implementation project, where we are about to discuss how to monitor daily work progress in the warehouse. So the hope is that this new feature will close a couple of gaps 🙂

In my project we plan to use the work pool to group pick work per receiving country. Work is grouped per country because there’s different cut-off times for different countries. The workers therefore knows that e.g. UK work pool has to be picked before e.g. US and other work pools.

So I tried setting up a visualization combining work pool id and work status (open, closed or in process). You can see the result below.

Work pool / work status visualization

My initial impression is that the visualization will solve the basic requirement – to provide overview on the on-going pick work per work pool. There are however a few issues – that I will get back to in the end of the post.

Visualization setup

Both setup and activation of the visualizations is done in the Outbound workload visualization menu item (Warehouse > Inquiries and reports > Outbound workload visualization).

When you open the menu item the first time – it will present a blank screen. Click on the Configure filters menu item to start setting up your visualizations. The “Configure filters” menu item is actually slightly misleading because the setup includes more than just the filtering of what data should be displayed. Could we change it to “Configure visualizations” instead?

In the “Configure Filter” screen you can setup the different visualizations. In the example below I have setup the Work pool / work status visualization.

Setup of work pool / work status visualization

Even though the setup is somewhat detailed it’s nowhere close to the Excel or Power BI experience. You can not control details like visualization type (there’s only one), graph colors, legends etc. But it does provide the ability to create a number of basic visualizations of Work and location data.

Detailed visualization setup

The X-axis group table and X-axis group field determines which table/field, that will be the used for primary grouping of information on the X-axis.

It’s nice that work header, work lines and locations fields can be included. They are for sure the typical tables you would want to select fields from. Perhaps Loads would also have been nice – to be able to visualize per load template (e.g. 20′, 40′, FTL, Pallet), load status etc.

The X-axis value table and X-axis value field determines the sub grouping of information on the x-axis. My guess is that you would typically want to use the work status field here to have a column for open work, closed work etc.

Work priority / work status visualization

Another important field is the Display level field. If set to Open lines then visualization will be per pick line. If set to Open headers it will count in full works. If you work with pallets and have 1 work per pallet – then I guess you should use the Open headers value. For scenarios with several items picked on the same work you would typically Open lines.

Work priority / work status visualization setup

Room for improvement?

I think the new outbound workload visualization is a great improvement for the WMS processes in D365 SCM. And I’m sure I will use on my next projects.

But it’s still a little rough around the edges. During my trials I received a number of “technical” errors – and at one point I have to delete all my usage data/personalization’s to be able to open the form.

I also experienced some minor bugs, including:

  • Order of values on x axis changed from ascending to descending
  • refreshing would change the colors of the bars so e.g. open work would shift from blue to orange color

Besides that – I found it easy and fast to setup visualizations. My hope would be that next version would support

  • Filtering on shipment date (e.g. to be able to filter out large orders released early)
  • Filtering (not just grouping) at work template level instead of just work order type
  • Visualization of work on the pack station
  • Better control of the visualization itself (color scheme, legend font size etc)

And finally a small tip: If you find the axis / legend text too small – then try to experiment with the browser zoom to get the best presentation of the visualization.

Vendor Managed Inventory with Powerapps and electronic reporting — May 5, 2020

Vendor Managed Inventory with Powerapps and electronic reporting

Dynamics 365 for Finance and Operations (D365FO) has basic support for Vendor Managed Inventory (VMI) in the form of Consignment replenishment orders.

From a warehouse perspective, there are however some serious limitations to consignment replenishment orders. In this post I discuss how you can overcome some of these limitations using Powerapps and Electronic Reporting.

VMI warehouse limitations

The main problem with consignment replenishment orders is that VMI items can only be received in non-warehouse management enabled warehouses. That’s a problem – because it forces you to have all your “normal” items in one (warehouse management enabled) warehouse and your VMI items in a separate non-warehouse management enabled warehouse.

This has serious implications for all processes where you would want to use your VMI items, including replenishment, raw material pick, sales order picking etc. All your normal scanner supported warehouse processes will simply not work with VMI items.

VMI replenishment pain points

In my company, a significant part of the raw materials on production sites are sourced as VMI items. So the primary warehouse process “suffering” from VMI items is the replenishment process to the production staging area.

The fact that VMI items must be kept in a non-warehouse-management enabled warehouse leads to the following two pain points:

  1. Zone replenishment can not be used to trigger and calculate the replenishment of production staging ares
  2. The actual picking of the VMI items can not be done using scanners, but must be done by entering inventory ownership change journal and subsequent transfer journal

On the site I’m currently working on, we have 3 production buildings that are regularly replenished from the same VMI area. Zone min/max replenishment would therefore have been the right thing for us, because each of the 3 production buildings are separate zones with individual min/max thresholds.

We ended up solving the first paint point with an Electronic Reporting based workaround that simulates zone replenishment. But in this post I will focus on the second pain point – not being able to pick VMI items with scanners.

VMI replenishment using Powerapps

The production site i’m currently working on, went live on D365FO early April 2020. The users quickly found the standard replenishment process for VMI items in D365FO to be very cumbersome.

This image has an empty alt attribute; its file name is standard-process.jpg

First they had to pick the items physically from the VMI area. Then they had to go back to a PC and register each combination of item/batch in the inventory change ownership journal. Then they also had to re-enter the exact same item/batch combinations in a transfer journal to get the items moved from the VMI warehouse to a trolley location in the main warehouse. So a typical replenishment trip could result in manual entering of 100-150 journal lines.

Apart from taking a lot of time – the manual entering of journal lines is also more likely to result in registration error.

We discussed a number of alternatives and ended up with a workaround based on a Powerapp and electronic reporting.

This image has an empty alt attribute; its file name is image-33.png

The Powerapp allows the worker to scan the items while picking them from the VMI locations. The Powerapp creates a Transfer order from the VMI warehouse to the main warehouse. The transfer order contains the items/batches scanned by the worker.

Electronic reporting is then used to generate the inventory ownership change journal.

Optimized VMI replenishment process

So the Powerapp will intially display a Transfer order header screen where From/To warehouse is displayed and the transfer order number is generated automatically. The user will basically just accept the proposed values by clicking the undefinedsign.

This will result in the creation of the Transfer order header in D365FO.

Next a pick screen is displayed with a white scan field at the top. In here the user scans location, item and batch barcodes.

The Powerapp will then automatically update the related fields with the scanned values. After scanning the user will click on the Quantity field and a numeric keyboard will be displayed on the scanner. The user enters the picked quantity.

When done the user will click on the undefined sign. This will result in the creation of a Transfer order line with the scanned item/batch/quantity.

The Powerapp will then present an empty pick screen again and the user will continue to scan next item/batch.

When all items have been scanned the user will click on the X sign and the Powerapp will display a complete list of the scanned items.

The user can then choose to edit/delete records before finalizing the picking using the standard canvas Powerapps user interface.

When done a transfer order has been created in D365FO with the scanned items.

Before the transfer order can be posted, an inventory ownership change journal must be generated and posted for each of the items in the transfer order. This part is handled by electronic reporting (more details on that in a follow-up post).

When the transfer order is posted – then the items are moved from the VMI warehouse to the main warehouse to a Trolley location where they will stay until they are putaway to the production staging locations in the production buildings.

How to create the Powerapp

I started by creating a canvas Powerapp based on the TransferOrderLines data entity:

This image has an empty alt attribute; its file name is image-3.png
This image has an empty alt attribute; its file name is image-4.png
This image has an empty alt attribute; its file name is image-6.png
This image has an empty alt attribute; its file name is image-8.png
This image has an empty alt attribute; its file name is image-12.png

This will give you a very “raw” app – like you can see below. But it will contain all the basic navigation to be able to create and edit transfer order lines.

I decided to change the theme to a black and green theme to give a somewhat similar experience as the “normal” warehouse app.

Next I adjusted which fields should be displayed and the field order on each screen.

Adding Transfer order header screen

Before adding transfer order lines you must be able to create a Transfer order header. To be able to do this, a Transfer order header screen was created like this:

The sign in the Transfer order header form was modified to open the Transfer order line creation form upon successful creation of the Transfer order header.

Calculating the Transfer number

One of the biggest challenges turned out to be the calculation of the Transfer order number. I did not manage to subtract a new number in the Transfer order number series. Instead I adjusted the number series in D365FO to allow manual override, to be able to calculate the new number series number manually:

A minimum transfer order number was defined as a global variable. This minimum number was set well above the normal Transfer order number series to avoid conflicts with transfer orders created from within D365.

The Transfer number was then calculated as the currently highest Transfer number + 1:

Receiving location main warehouse

Another challenge is to control which locations the items are received in your main warehouse. In our production site we do not receive items using WHS scanners. Items are received using Arrival overview journal. I was therefore able to specify my trolley location as the main receiving location in my main warehouse.

But if you are receiving your items using whs scanners – then you can not solve it like this. Then you can control the receiving location by setting the standard receive location on each VMI item like this:

Wrap up

So half of the VMI replenishment problem has now been “worked-around”. The workers are now able to scan items during replenishment picking using the Powerapp. The Powerapp creates a Transfer order that will move items from the VMI warehouse to a Trolley location in the main warehouse.

What’s still missing is the creation of the inventory ownership change journal. Because there is no data entity for that in D365FO, the powerapp can not create these journal lines. This can however be “worked-around” using Electronic reporting. I will get into more details on that in part II of this little blog series on Vendor managed inventory replenishment.

Until then – feel free to have a look at my example Powerapp here.

Eliminating gaps with Configurable business documents — February 12, 2020

Eliminating gaps with Configurable business documents

In this post I look into how configurable business documents can be used to fulfill many document requirements, that has previously been considered gaps in D365FO. These gaps can now be eliminated by configuring… the configurable business documents.

The obvious use of configurable business documents is to adjust the layout of all the predefined business documents like order confirmation, invoice, picking list, etc. Read more about that here and here.

Create new document types

But configurable business documents can also be tweaked to create entirely new document types and trigger them from relevant places in the business process.

As an example I will demonstrate how you can setup configurable business documents to generate a proforma invoice from a Transfer order – something that’s not possible without configurable business documents.

But why would you need a proforma invoice for a transfer order? Well – in my company, we regularly move items between warehouses, that are located in different continents of the world, but still owned by the same legal entity. Technically this is handled as a Transfer order in D365FO between two warehouses. The problem is that the movement across continents requires a commercial invoice type document for customs purposes.

D365FO actually have a commercial invoice and also a proforma invoice – which could both be used for this purpose. But unfortunately they are tied to a sales order transaction and not a transfer order transaction.

Fortunately we can use configurable business documents to create proforma invoice and trigger it from a Transfer order.

Generating a Transfer order proforma invoice

Before I go into details on how to configure a Transfer order proforma invoice – I would like to show you the finished result first.

So I have a normal Transfer order. The transfer order has been picked in the warehouse and also packed in several containers. To generate the Transfer order invoice I click on Load details to open the related load.

In the loads form I activate the Load list report. The load list report is normally a report that contains strictly load related information. But by changing configuration i have “injected” a Transfer order proforma invoice document instead.

So instead of printing a normal load list report – a proforma invoice is now printed – based on the information on the transfer order and a lot of other derived information – including sales prices from trade agreements and packing information from warehouse containers and more.

Trigger proforma invoice instead of load list report

So I have created a completely new data model, model mapping and excel report for the Transfer order proforma invoice in the electronic reporting configurations form (see below). Together they contain the configuration required to print a Transfer order proforma invoice. I will get into some details about them later in the post.

But for now I just want to focus on how you can get your own report triggered from the load list report menu item. The way to achieve that is to the add the same tag types as for the load list:

When you do that, your own electronic report configuration suddenly becomes available the print document setup

Transfer load information to the report

A challenge I had, was to get load id and other information transferred from the load (where I click the load list report menu item) to the report – and thereby allowing me to lookup related information in the transfer order table, prices etc.

I solved it by looking at Load list report data model. I “stole” the setup below – and then found that I had access to the load id and all other fields on the load.

Extracting price and container information

An important element on the proforma invoice are the sales prices. Unfortunately transfer orders do not contain any prices. To solve that I lookup the sales prices in trade agreements with the load line item as input.

This is possible in the data model mapping formula designer using SQL like formulas. The nice thing here is that you can lookup data directly in tables – no data entities are required.

Similarly container information like container id, weight and volume is looked up by searching for all containers with same shipment id as on the load.

There are quite a few other details I could talk about – but it would make a very long post. Instead you are welcome to download some example configuration files and perhaps get inspired 🙂

Configurable warehouse business documents – part 2 — January 6, 2020

Configurable warehouse business documents – part 2

In my previous post Configurable warehouse business documents, I examined if the warehouse pick list layout in D365FO could be configured by superusers and consultants without the need for developer assistance. Using the new configurable business documents (CBD hereafter) framework I was able to remove irrelevant information like load/order barcodes and the print work step.

First try at configuring CBD pick list – load/order barcodes and print step removed

In this post I will examine how new information can be added to the pick list (and other CBD documents). To illustrate the process, I will be adding the sales pool field from the sales order to the pick list.

The sales pool field can be used to group sales orders into logical order pools, like normal orders, express orders etc. and can provide extra context to the warehouse worker performing pick/pack/ship operations.

This is the second of three posts on configurable business documents. Click here to open first post: Configurable warehouse business documents. Click here to open the third post: Eliminating gaps with Configurable business documents

Basic CBD / electronic reporting concepts

Before going into details with adding information to the pick list, I will just spend a few words on some basic CBD / electronic reporting (hereafter ER) concepts.

A Data model contains a model of the data to be exposed in a CBD document. The ER data model is mapped to D365FO tables and fields through a data model mapping.

A format is a representation of the data in a data model. The representation can come in many formats – like Excel, word, PDF, XML etc. All the new CBD documents are Excel formats. The ER format is mapped to the ER data model by a Format mapping. The format mapping for CBD documents is basically mapping of Excel cell name ranges to the ER data model. The format mapping can be done in Excel or optionally in the electronic reporting configuration form.

Relationship between F&O database, ER data model and ER format. From Microsoft CBD techtalk

Data model is key

Adding new fields to the pick list (and any other Configurable business document) is easy – if the field you want to add – is already included in the data model for the document. You can watch a short video on that here. But if your field is not included in the data model – which is the case with the sales pool field – then it requires a little more effort.

In this post I will focus on how you can extend your CBD document with new fields – that are not included in Microsofts standard ER data models.

Create a derived data model

If you want to add new fields to a CBD data model – then you do it by creating a derived data model. The derived data model in this example will be derived from the original pick list data model delivered by Microsoft. It will contain the same fields as the original data model – and can be extended with your own fields – like the sales pool field.

Creation of derived data models is done in the Electronic reporting framework. Open the Electronic reporting workspace and click on the Reporting configurations tile.

Find the data model used for pick lists – it’s called Packing list model – and create a new derived data model configuration as displayed below.

A new derived data model is now created. Mark it and click on the Designer menu item. Add the sales pool field to the model as displayed below.

Save the model and exit.

Change the status of your modified model to completed – otherwise you will not be able to reference it in the subsequent steps.

Create a derived data model mapping

The data model itself does not contain any information about which tables/fields that should be used in the pick list. This is stored in a data model mapping configuration. Similar to the data model, you also need to create a derived data model mapping – to bind the sales pool field in the data model to the sales pool field on the sales order table.

Now find the data model mapping used for the pick list in the Reporting configurations form – it’s called Shipping pick list model mapping. You can’t modify it directly – so again create a derived custom model mapping as displayed below.

Mark the new derived data model mapping and click on the Designer menu item. In the form below click Designer menu item again.

Now locate the Sales pool field in the data model section (right part of the screen) and find the Sales pool field in the data source section (left part). Click Bind to link them.

Finding the correct field in the left part requires some decent knowledge about the data structure in sales order /warehouse area. I did a number of trials before I got it right. But the relations underneath each table are powerful in the sense that they will allow you to bind to fields from joined tables.

Save and exit. Change status to completed.

Now the Sales pool field is added to the datamodel and mapped to the correct field on the sales order.

Creating a derived pick list format

Next step is to create a derived pick list format – based in the new custom data model and mapping. Find the standard pick list format – in this case the Shipping pick list for shipment (Excel) and create a derived custom pick list as displayed below.

Now complete the new configuration

Insert sales pool field in pick list

And now we are ready to insert the sales pool field into the excel pick list template. Open the Business document management form. Mark the correct shipping pick list. It’s a little confusing that all the pick list variants are listed with the same name – so I had to look into the details form – to determine which one was my derived pick list.

Now insert the new sales pool field

I had some trouble creating the range for the correct cell. Even though I placed the cursor in the correct cell before adding the range – it would propose a different cell. I found that if I edited the cell with F2 before adding the new cell – then it would point to the correct cell.

Finally bind the new sales pool cell range with the sales pool field in the data model.

Publish your new template and make sure that Print management is setup to point to your new layout. The final result looks like this.

You may also notice that I “enhanced” the notes section of the pick list. In Excel I just selected the notes cell in the excel template and increased font size and changed color to orange. I also applied the changes discussed in my first post (removing the load/order barcodes and print step).

Finally I changed the company logo. I never found out if it was supposed to take the report logo you can setup in legal entities. That did not work for me – so I simply inserted my company logo directly in the Excel template.

Limitations

My work with these CBD blog posts has revealed a couple of limitations that you should be aware of.

Direct print of the pick list (or any other CBD documents) to a printer is not supported currently. You have to open the excel file and then print it from there. For most CBD documents that’s not a major issue – because you typically send them by mail. But for documents that are physically attached to items (like the pick list, packing slip etc.) that is a very real problem.

Low volume warehouses with few orders may be able to accept it, but for medium/high volume warehouses – it’s not a viable solution.

On my to-do list is to examine if the print issue can be worked-around by printing to the printers email address instead.

Another related issue is that the periodic job that prints pick list does not seem to be able to print the CBD version of the pick list – but only the SSRS version.

Configurable business documents – applicability 

Configurable business documents provides new and promising opportunities for superusers and consultants to adjust layout and content of business documents in D365FO.

The technology is however so new, that I need to spend (much) more time working with it to get a better understanding of which document scenarios that are well suited for CBD.

Here’s my to-do list for further exploring…

  • How easy is it to model customer directed business documents with complex layout requirements?
  • Performance of CBD documents versus SSRS documents?
  • Can lacking printer support be replaced by sending emails to printer?
  • Process for creating Word / PDF versions of Configurable business documents
Configurable warehouse business documents — December 19, 2019

Configurable warehouse business documents

With the introduction of configurable business documents for D365FO, it’s now possible to configure the layout and content of many of the business documents in D365FO. This also includes warehouse documents like pick list, container contents, load list, commercial invoice etc.

The configuration is done in excel and word and in some cases in the Electronic reporting framework.

In this post I examine if the warehouse pick list layout can be improved without the need for developer assistance.

This is the first of three posts on configurable business documents. Click here to open the second post: Configurable warehouse business documents – part 2. Click here to open the third post: Eliminating gaps with Configurable business documents

Original warehouse pick list

My experience is that warehouse workers typically find the warehouse pick list in D365FO confusing. First confusing thing is that the pick list contains 4! different barcodes. So which one should you scan?

Furthermore core information like item number, location and qty is squeezed together in the right part of the list to make room for the work barcode.

Original SSRS version of the picklist

Another annoying thing is that the Print work type lines are also listed, which is just additional unusable text to the picker. Optimally the pick list should only contain exactly the information that is required to complete the picking process.

Configurable pick list

As part of the configurable business documents feature a new pick list has been designed. The layout of the new pick list is nicer than the SSRS original – but there’s still room for improvement. It still has too many barcodes and the Print step is still displayed.

The good news is that you can now change the layout.

New configurable business documents version of the pick list

Change the pick list layout

Before you can change the layout, you must find the pick list in the Business document management workspace.

You can find all the configurable business documents in the Business documents workspace

Mark the business document you want to configure and click New Template

Give the new template a suitable name:

Normally Excel online should display the template. Sometimes I experienced that excel opened – but did not display the new template. I would then have to go back to D365FO and reopen the template.

Removing useless barcodes

First of all I wanted to get rid of the barcodes that I know I’m not going to use in my current D365FO project. In this case the load id barcode and the order number barcode.

I first tried simply to delete the cells containing the barcodes – only to find out that you get a validation error because you delete the Excel name related to the cell.

I then simply changed the font color of the bar code to white – which effectively made it invisible.

Remove print work step

The second goal I wanted to obtain was to remove the print steps. I tried conditional formatting and other approaches but found nothing in excel that would hide the print step row.

So instead I fixed the filtering of the print step in the Electronic Reporting format designer by adding the filter below on line values:

And finally a pick list without the annoying load/order barcodes and print steps:

Reduce warehouse costs using shipment consolidation — October 17, 2019

Reduce warehouse costs using shipment consolidation

The Dynamics 365 2019 release wave 2 contains so much new WMS functionality, that you really have to invest considerable time to digest and understand all the new features becoming available in the coming months.

In this post I will be looking into shipment consolidation – an area that has been significantly improved with the introduction of shipment consolidation policies in wave 2.

What is shipment consolidation?

Shipment consolidation is about consolidating several sales orders from the same customer into one shipment. Consolidation of several orders into one shipment is attractive because it can reduce warehouse labor and shipping costs.

Shipment consolidation example

Imagine a situation where a customer places an order at a company shipping orders in parcels to their customers. After receiving the order, it’s released to the warehouse. Now 10 minutes after the customer places a second order which is also released to warehouse.

Without any consolidation, the system will generate two shipments, two pick works, which will result in two pick tasks, two pack tasks and shipment of two individual parcels to the customer.

With shipment consolidation, the two orders are consolidated into one shipment, one pick task, one pack task and only one parcel to be shipped.

The result is saved time for both pickers, packers and lower shipment costs.

Improved shipment consolidation

Automatic shipment consolidation has been available in previous versions of D365FO, but had some severe limitations. With the new shipment consolidation policies most of these limitations are now eliminated.

One of the major improvements is that consolidation setup can now be setup per customer, customer requisition no or any other field on the sales order. Previously you had to decide at the warehouse level whether consolidation should be performed or not.

Another great improvement is that consolidation is now also supported for other release to warehouse methods, than the Automatic release of sales orders job. This means that consolidation is now also supported when using the release to warehouse menu item directly on the sales order and when releasing from load planning workbench.

Finally the timing has been more flexible. Previously only orders released during the same execution of the Automatic release of sales orders job was consolidated. Now orders released at different points in time can also be consolidated.

Shipment consolidation policy form

Shipment consolidation is now setup in a new Shipment consolidation policy form. When you open the form the first time it will be blank – until you activate the Create default Setup button, which will create a default consolidation policy.

You can now modify the default policy or create new policies. You can create as many policies as you like. The Policy sequence controls the order in which the policies will be evaluated. The lower the sequence number – the higher the priority.

Customer specific consolidation example

In the example below I have defined a specific consolidation policy for the US-027 Birch customer. The new policy is setup to consolidate new shipments with existing open shipments. I have given the new policy sequence no. 1 – meaning that it will be evaluated before the default policy which is setup to not consolidate orders

Select Edit query menu item to setup when the policy should be applied. You can filter on most fields from the sales order and load details.

Consolidation query is setup to only have effect for Birch customer

Testing the consolidation policy

To test the new consolidation policy I have created and released the sales order below.

The result is a new shipment

Now I create a second order for Birch customer and release it.

Due to the shipment consolidation policy, the second order has been consolidated with the first sales order on the same shipment.

Now I process the wave related to the shipment and a consolidated pick work is created, containing items for both sales orders.

And from here pick, pack and ship can be performed on the consolidated shipment. These processes do not differ from non-consolidated shipments – so I will not go into details with them.

Bonus info

A dedicated Shipment consolidation workbench will also be introduced – that will allow you to consolidate already created shipments using the shipment consolidation policies.

Update 11-11-2019: Jürgen Weber hinted me that the following limitations (and workaround) apply to the shipment consolidation feature:

  • It’s only possible to consolidate shipments with status Open. Once the wave related to a shipment is processed, then the shipment will change status to Waved and it will no longer be possible to consolidate
  • It’s not possible to group shipments according to ship date. This is an issue if you have several orders planned for the same customer – but with different ship dates. This issue can be solved by scheduling different Automatic release to warehouse batch jobs that run in sequence after each other. One job for shipments with shipment today (day(0)), one for shipments with ship date tomorrow (day(1)), etc.. This will ensure that shipments with different ship dates will not be consolidated..

Zone replenishment — August 7, 2019

Zone replenishment

Dynamics 365 for finance and operations (hereafter D365FO) already supports a number of replenishment variations in the warehouse, including wave, load and min/max replenishment.

With version 10.0.2 a new replenishment variation, called Zone replenishment is available for preview and generally available October 2019.

Why zone replenishment?

Zone replenishment solves a rather common gap related to the existing min/max replenishment process.

In Min/max replenishment you typically setup a fixed location for an item and whenever on-hand on that specific location decreases below a minimum threshold, replenishment work is generated.

The replenishment work directs the warehouse worker to replenish the fixed location up to to the maximum value specified for the fixed location.

Zone replenishment example 1 – total qty in pick zone (40+30=70) is below minimum (100)

But some warehouses do not want to specify the min/max thresholds for a particular location – but rather for a zone. They don’t care if a specific location is below minimum – as long as the zone – as a whole – is above the minimum. Zone replenishment solves exactly that requirement.

So instead of specifying min/max thresholds for a specific location, you specify min/max for a whole zone when working with zone replenishment.

Zone replenishment example 2 – total qty in pick zone (30+80=110) is above minimum (100)

Whenever on-hand in the zone decreases below the minimum threshold, replenishment work will be generated.

Zone replenishment work will direct the worker to replenish up to the max value specified for the zone. The put location can be any location in the zone.

Zone replenishment advantages

One important advantage with zone replenishment, compared to normal min/max replenishment, is that you do not need to maintain fixed locations for each item – which can be a time consuming task. Typically re-slotting of fixed locations tend to be neglected – which over time will result in poor pick performance.

Another advantage with zone replenishment is that you can setup more dynamic rules to control the optimal put location. It could be that high runner items are directed to the best locations in the zone, whereas slow moving items are directed to less attractive locations in the zone.

Zone replenishment templates

Zone replenishment is setup with replenishment templates – as you may know from normal min/max and demand replenishment.

The replenishment template setup is pretty similar to normal Min/max replenishment – with the following exceptions:

  • The min/max values apply to a zone instead of a fixed location
  • A directive code dedicated to zone replenishment must be specified. This is used to link a put location directive to the replenishment template. The location directive will determine where in the zone the items will be put.
  • You select a zone instead of referring to a fixed location

Location directive setup

Like normal min/max replenishment, a pick location directive must be setup to specify possible pick locations for zone replenishing.

Unlike normal min/max replenishment, a put location directive must also be setup to specify where to put the items in the zone.

In the Location directive Actions query specify the same zone as specified in the replenishment template, to make sure the items are directed to the correct zone:

In my example I have chosen the “Empty location no incoming work” strategy, which will find the first empty location in the zone, but I could also have selected the consolidate strategy or used stocking limits to control the put location. I have not tested these variations though – so you must experiment with these sub variations yourself 🙂

Besides the location directive you must also setup a valid replenishment work template. The work template does not differ from other replenishment variations, so I will not go into detail with that here.

How to generate zone replenishment work

To illustrate the zone replenishment work generation, I have setup on-hand for item A0001 as follows:

The total qty of the item in the zone is 70, which is below the minimum threshold for the zone which was setup as 100 on the replenishment template. So replenishment work should be generated when executing the replenishment job.

Zone replenishment work is generated by activating the replenishment job also used for normal min/max replenishment.

Select the zone replenishment template that contains the zone replenishment thresholds.

Work, work, work

When the replenishment job has completed, then the resulting replenishment work can be viewed in the work details form.

The resulting work in my example looks like this:

The replenishment work can now be executed like all other replenishment work on the warehouse app. The actual execution does not differ from other replenishment variations – so I will not go into detail on this.

Bonus information

One thing you should be aware of, is that zone replenishment works best with system directed replenishment – meaning that the system decides the put location.

You can though, set it up to be user directed – meaning the put location is blank and the worker must decide the actual put location in the zone – but you will run into a couple of issues:

  • The worker can not see on the work which zone the work is intended for. If you only replenish one zone – then this is not a problem – but if you replenish several zones then you have a challenge.
  • If you run the replenishment job again – it will not take any open previously generated work against the zone into account. Probably because the work has no put location.

In the preview version, you are able to specify more than one zone on the replenishment line. It doesn’t really make sense to me because you are not able to setup the put location for more than one zone.

Not much documentation is available yet – I have only been able to find this https://docs.microsoft.com/en-us/dynamics365-release-plan/2019wave2/dynamics365-finance-operations/zone-based-replenishment

Confirm and Transfer — May 9, 2019

Confirm and Transfer

As part of the 10.0.1 release of Dynamics 365 for operations (hereafter D365FO) Microsoft released a small – but very useful feature called Confirm and Transfer.

The Confirm and transfer feature is solving a very annoying issue in the current warehouse loading process.

This feature is part of a “wave” of new warehouse features originating from the acquisition of Blue Horseshoe’s AWAX product.

Loading surprises

Imagine warehouse workers have picked 43 pallets to be loaded onto a double deck truck. The pallets have been staged nicely on the dock – ready to be loaded. The truck arrives – but for some reason the carrier sent a standard truck – and not a double deck.

Now only 33 pallets can be loaded to the truck and the remaining 10 will have to be sent on a later truck. Before the Confirm and transfer feature you would have to unpick the 10 pallets, re-release to warehouse and repick them again (systemwise). This can be a very time consuming and annoying process – especially if you work with batch or serialized items.

Confirm and Transfer to another load / truck

The confirm and transfer feature solves this by allowing the warehouse workers to confirm the first load (with the 33 pallets) and transferring all remaining pallets to a new load – where they remain picked and ready to be loaded.

Activate the flighted feature

Before you can use the feature make sure it’s activated. If you can see the the field “Allow load split during ship confirm” in the load templates form – then you are good to go.

If not, then you must activate the flighted feature in MS SQL management studio using the following query:

I had to restart the environment before the feature was visible in the application. Note that in production environments, you will need Microsoft to do the flighting part.

Setup load templates

Next you must activate the new feature for each load template:

And now you are ready to use confirm and transfer.

Confirm and transfer example

I have created a Truck DD load where I have picked 5 pallets, but the truck only had room for 3 pallets. So two pallets must remain on the staging location.

Now I confirm the load and the system allows me to split the 2 pallets on the dock to a new load:

My original load is now confirmed and only contains the 3 loaded pallets:

A new load has been created with the remaining 2 pallets:

When the second truck arrives, they remaining 2 pallets can be loaded onto that truck.

Other nice things to know

The confirm and transfer feature can also transfer work in process to a new load. This means that pallets that are being picked can also be transferred.

You can also control on a specific load whether split is allowed:

Though this feature is nice it will not replace the Transport Load feature. It’s intended for transferring items from a load to another. Not to split a large “virtual” load into many loads representing the actual trucks.

If you are using the TMS module, then be aware that the new split load must be re-rate/routed.